Today I'll show a couple of tricks to determine bandwidth of a conversation between two hosts and a trick to help quickly determine top bandwidth users on a network. To do this, download and install the massively powerful free Network Protocol Analyzer, Wireshark.
First, we'll look at how to determine the average bandwidth between two hosts. I first came across the need for this information when I was tasked to plan a move of a department from one site to another. The users of this department need to use a specialized application hosted at the original site, but bandwidth may be an issue. To test, we bought one user's computer to the second site and had him log in and use the software. Even if the test is successful, we need to know the bandwidth impact of not just one user, but of the entire department (in this case, ten users). We needed to find this one user's usage, then we could multiply by the number of users and get an approximate average bandwidth need. To find this:
1. Open Wireshark.
2. Click on Capture, then Interfaces.
3. Your available network interfaces will appear. Find the interface you wish to monitor, then click Options.
4. The Capture Options window will appear. Since we're monitoring the communication between two hosts, we only want to see the traffic between the two. Type host {IP of one host} && host {IP of other host} next to the Capture Filter button. This feature is actually really powerful, allowing you to monitor just per port, per network, exclude hosts or port or networks, etc. For a good list of capture filter options, look at The Wireshark Wiki or this site: http://home.insight.rr.com/procana/.
5. It's a good idea to save your capture to a file. To set this up, enter a location and file name next to the File field.
6. Click the Start button to start your capture.
7. At this point you'll start seeing the packets being captured. Start running your tests.
8. After you're done testing, click Capture, then click Stop. Depending on the size of the capture, it may take a minute or two for the capture to fully stop.
9. Now, click Statistics and click Summary. The Wireshark:Summary window will appear.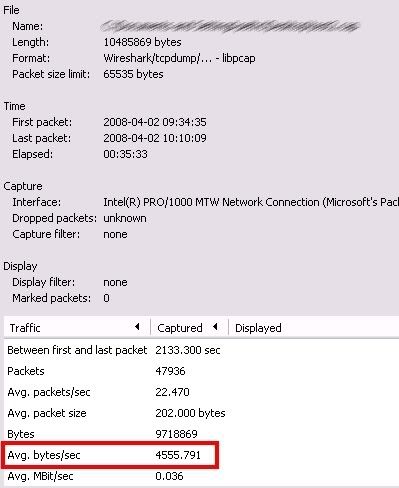
Here is the summary of the communications between the two hosts. In my example, the Avg bytes/sec is 4555.791, or approx 4.6Kbps. This can help you determine your bandwidth needs for an application or will help you recognize if one client is taking up more bandwidth than it should. When determining bandwidth needs, you have to realize that this is the AVERAGE bytes per second, not the maximum. There may be certain times that the host could take exceed that, such as on an application open or save. With proper testing, such as taking measurements during each section of the test, you can verify if this is the case and can help you plan accordingly.
You can also use this method to determine if a client is taking up much more bandwidth than it should. If you can capture all communications on a network, such as mirroring your WAN (or Internet) port, you can find out what host is transmitting the most packets or the most bytes. To do this:
1. Start a capture like listed above, but skip the Capture Filter.
2. Once you feel that you have an adequately sized sample, stop the capture.
3. Click Statistics and choose Conversations.
4. I typically choose the IPv4 tab.
5. You can sort by Packets or by Bytes. 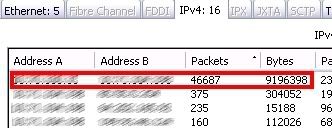
In my example, you can see that the top conversation between Address A and Address B has sent many more packets and many more Bytes than the next host. This can help you find out your biggest bandwidth users and will show you whom they are talking to. I've actually used this method to find out some of my bigger users of my Internet bandwidth and was able to determine that the biggest bandwidth hog was those users listening to streaming Internet radio, which gave justification for web filtering.
Wireshark is powerful tool as shown above, but it is much more powerful if utilized well. Also to note, Wireshark was previously known as Ethereal. When searching for more information, most Ethereal information should be applicable to Wireshark.
April 04, 2008
Subscribe to:
Posts (Atom)